
Tech
High Growth Tech Stocks To Watch In The United States

The market is up 1.2% over the last week, with the Information Technology sector up 1.0%. In the last year, the market has climbed 26%, and earnings are forecast to grow by 15% annually. In this favorable environment, identifying high growth tech stocks that can leverage these trends is crucial for investors seeking robust returns.
Top 10 High Growth Tech Companies In The United States
|
Name |
Revenue Growth |
Earnings Growth |
Growth Rating |
|---|---|---|---|
|
TG Therapeutics |
28.62% |
43.05% |
★★★★★★ |
|
Sarepta Therapeutics |
24.22% |
44.94% |
★★★★★★ |
|
Invivyd |
42.85% |
71.50% |
★★★★★★ |
|
Ardelyx |
27.44% |
65.50% |
★★★★★★ |
|
Super Micro Computer |
20.76% |
28.05% |
★★★★★★ |
|
Iris Energy |
69.80% |
125.09% |
★★★★★★ |
|
G1 Therapeutics |
27.57% |
57.75% |
★★★★★★ |
|
Clene |
73.06% |
62.58% |
★★★★★★ |
|
Seagen |
22.57% |
71.80% |
★★★★★★ |
|
ImmunoGen |
26.00% |
45.85% |
★★★★★★ |
Click here to see the full list of 248 stocks from our US High Growth Tech and AI Stocks screener.
Let’s uncover some gems from our specialized screener.
Simply Wall St Growth Rating: ★★★★☆☆
Overview: Flex Ltd. provides manufacturing solutions to various brands across Asia, the Americas, and Europe and has a market cap of $13.08 billion.
Operations: Flex Ltd. generates revenue primarily from two segments: Flex Agility Solutions ($13.69 billion) and Flex Reliability Solutions ($12.15 billion). The company’s operations span Asia, the Americas, and Europe, providing diverse manufacturing solutions to various brands.
Flex is making significant strides in the tech industry, particularly with its recent $498.91 million fixed-income offering and strategic collaboration with Musashi Energy Solutions. The company’s earnings are forecast to grow 20.6% annually, outpacing the US market’s 15.2%. Flex’s R&D expenses reflect a strong commitment to innovation, and their CESS technology aims to mitigate power fluctuations in AI data centers. From April to June 2024, Flex repurchased 15.29 million shares for $456.92 million, indicating robust financial health and shareholder value focus.

Simply Wall St Growth Rating: ★★★★☆☆
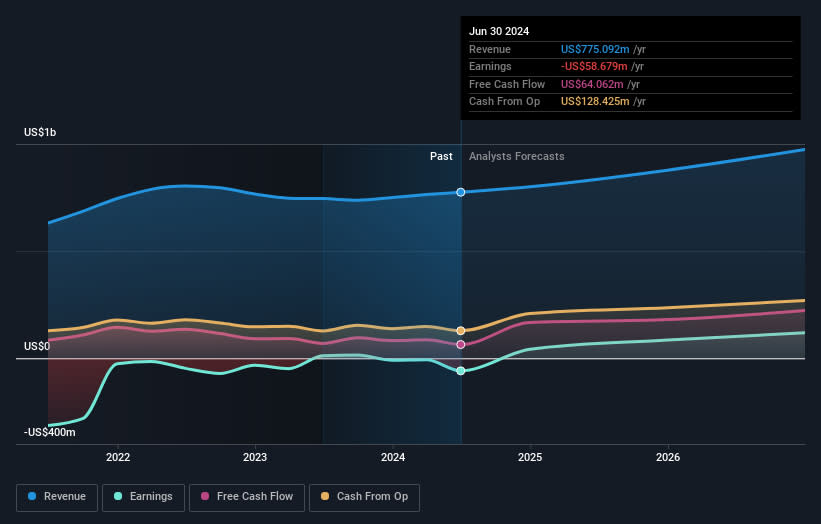
Overview: GoodRx Holdings, Inc., along with its subsidiaries, provides tools and information for consumers to compare prices and save on prescription drug purchases in the United States, with a market cap of approximately $3.12 billion.
Operations: GoodRx Holdings generates revenue primarily from its healthcare software segment, which reported $775.09 million. The company focuses on providing tools and information for consumers to compare prescription drug prices and save money in the United States.
GoodRx Holdings is navigating a challenging landscape with a forecasted revenue growth of 9.5% annually, slightly outpacing the US market’s 8.8%. Despite recent earnings guidance adjustments, their R&D expenditure underscores commitment to innovation in healthcare affordability initiatives. The company’s collaboration with Boehringer Ingelheim to offer Adalimumab-adbm at $550 per two-pack represents a significant step towards reducing patient costs by 92%. Earnings are projected to grow at an impressive rate of 50.84% per year, indicating potential profitability within three years.
Simply Wall St Growth Rating: ★★★★★☆
Overview: Nutanix, Inc. offers an enterprise cloud platform across various global regions including North America, Europe, the Asia Pacific, the Middle East, Latin America, and Africa with a market cap of $13.16 billion.
Operations: Nutanix, Inc. generates revenue primarily from its Internet Software & Services segment, amounting to $2.10 billion. The company operates across multiple global regions and focuses on providing an enterprise cloud platform.
Nutanix’s revenue growth of 13.6% annually outpaces the US market’s 8.8%, reflecting its robust position in the tech sector. The company’s R&D expenses, which stand at $290 million, highlight a strong focus on innovation and product development. Earnings are forecast to grow an impressive 85.2% per year over the next three years, suggesting significant future profitability potential. Recent share repurchases totaling $106 million indicate confidence in long-term value creation for shareholders.

Next Steps
-
Click here to access our complete index of 248 US High Growth Tech and AI Stocks.
-
Shareholder in one or more of these companies? Ensure you’re never caught off-guard by adding your portfolio in Simply Wall St for timely alerts on significant stock developments.
-
Unlock the power of informed investing with Simply Wall St, your free guide to navigating stock markets worldwide.
Curious About Other Options?
This article by Simply Wall St is general in nature. We provide commentary based on historical data and analyst forecasts only using an unbiased methodology and our articles are not intended to be financial advice. It does not constitute a recommendation to buy or sell any stock, and does not take account of your objectives, or your financial situation. We aim to bring you long-term focused analysis driven by fundamental data. Note that our analysis may not factor in the latest price-sensitive company announcements or qualitative material. Simply Wall St has no position in any stocks mentioned.
Companies discussed in this article include NasdaqGS:FLEX NasdaqGS:GDRX and NasdaqGS:NTNX.
Have feedback on this article? Concerned about the content? Get in touch with us directly. Alternatively, email editorial-team@simplywallst.com

Curaçao-licensed BC Game rejects bankruptcy ruling amid claims it owes players

The Basics of Financial Literacy for Online Gamblers – Olive Press News Spain

How Can You Make Money Gambling at Online Casinos at Home? – Olive Press News Spain

The Best Online Casinos Available in Spain – Olive Press News Spain

Secrets to Winning at New Online Casinos: Top Strategies – London Post

KSA Fines BetOnline Owner for Illegal Gambling in the Netherlands

How The Website Layout of an Online Casino Influences Your Play

Best Plinko Gambling Sites 2024 – Top Plinko Casino Games

Adani setback 2.0: US indictment sends shockwaves across India and world – Times of India
