Jobs
The 25 Best Cities To Move to With Cheap Housing and a Strong Job Market

With many American families struggling with high rent, credit card debt and student loans, it might be difficult to find an affordable place to lay down roots.
Finding a place to live with good-paying jobs and affordable housing is certainly a delicate balance. Many U.S. cities have one or the other, with American families assuming that a city with decent wages will come with high housing costs. But luckily, there are plenty of cities that offer the best of both worlds.
Learn More: States Whose Economies Are Failing vs. States Whose Economies Are Thriving
Find Out: 3 Things You Must Do When Your Retirement Savings Reach $50,000
To identify cities in the U.S. that have plenty of jobs and cheap housing, GOBankingRates gathered information on the 200 biggest housing markets in the U.S., according to Zillow. We gathered data available regarding the typical home value and monthly rent as of June 2024, as well as its Metro Statistical Area unemployment rate, according to the June 2024 Bureau of Labor Statistics data.
The 25 cities in the final ranking have values lower than the U.S. national average in all of the above factors. Additional data on labor force participation and livability score was gathered from the American Community Survey and AreaVibes.
Keep reading to find out if your city has cheap housing and job opportunities.
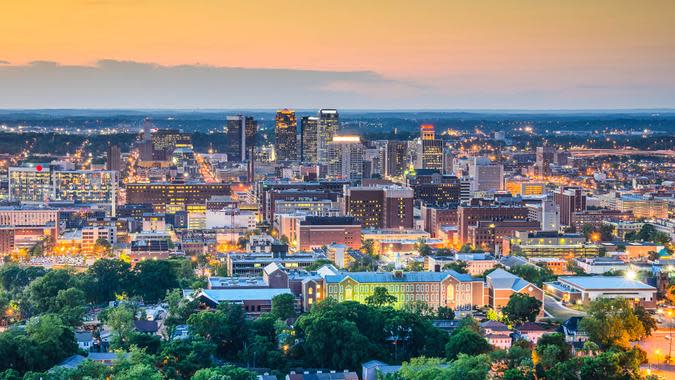

1. Birmingham, Alabama
-
Typical home value: $126,757
-
Typical rent: $1,338
-
Unemployment rate: 2.7%
-
Labor force participation rate: 57.9%
-
Median household income: $42,464
-
Livability score (out of 100): 67
Check Out: These Are America’s Wealthiest Suburbs
For You: What the Upper Middle Class Make in Different US Cities
Earning passive income doesn’t need to be difficult. You can start this week.
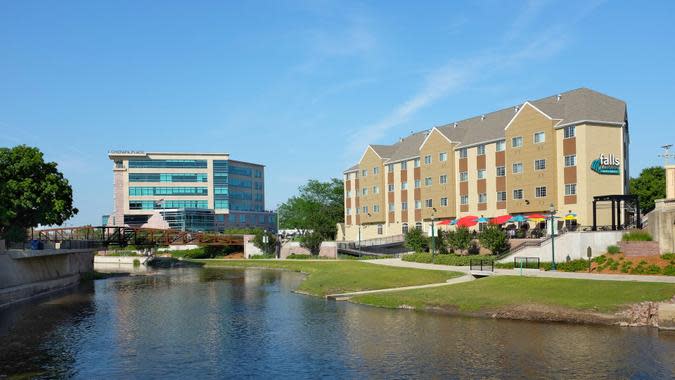

2. Sioux Falls, South Dakota
-
Typical home value: $329,429
-
Typical rent: $1,205
-
Unemployment rate: 1.9%
-
Labor force participation rate: 74.2%
-
Median household income: $71,785
-
Livability score (out of 100): 85
Trending Now: Here’s the Salary Needed to Actually Take Home $100K in Every State


3. Des Moines, Iowa
-
Typical home value: $208,871
-
Typical rent: $1,114
-
Unemployment rate: 2.9%
-
Labor force participation rate: 70%
-
Median household income: $62,378
-
Livability score (out of 100): 83


4. Montgomery, Alabama
-
Typical home value: $143,945
-
Typical rent: $1,301
-
Unemployment rate: 3%
-
Labor force participation rate: 59.7%
-
Median household income: $54,166
-
Livability score (out of 100): 64


5. Huntsville, Alabama
-
Typical home value: $287,351
-
Typical rent: $1,382
-
Unemployment rate: 2.5%
-
Labor force participation rate: 63.4%
-
Median household income: $67,874
-
Livability score (out of 100): 83


6. Little Rock, Arkansas
-
Typical home value: $214,995
-
Typical rent: $1,202
-
Unemployment rate: 3.4%
-
Labor force participation rate: 64.8%
-
Median household income: $58,697
-
Livability score (out of 100): 72
Find Out: Here’s the Income Needed To Be in the Top 1% in All 50 States


7. Amarillo, Texas
-
Typical home value: $202,017
-
Typical rent: $1,286
-
Unemployment rate: 3.4%
-
Labor force participation rate: 65.6%
-
Median household income: $60,628
-
Livability score (out of 100): 66


8. Lincoln, Nebraska
-
Typical home value: $284,822
-
Typical rent: $1,294
-
Unemployment rate: 3%
-
Labor force participation rate: 70.9%
-
Median household income: $67,846
-
Livability score (out of 100): 84
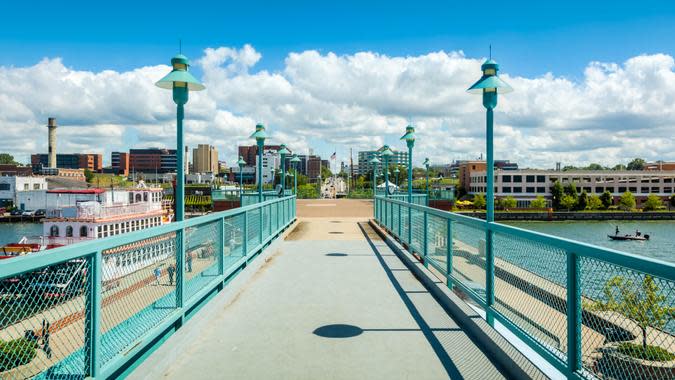

9. Erie, Pennsylvania
-
Typical home value: $181,423
-
Typical rent: $1,006
-
Unemployment rate: 3.9%
-
Labor force participation rate: 59.2%
-
Median household income: $43,135
-
Livability score (out of 100): 82
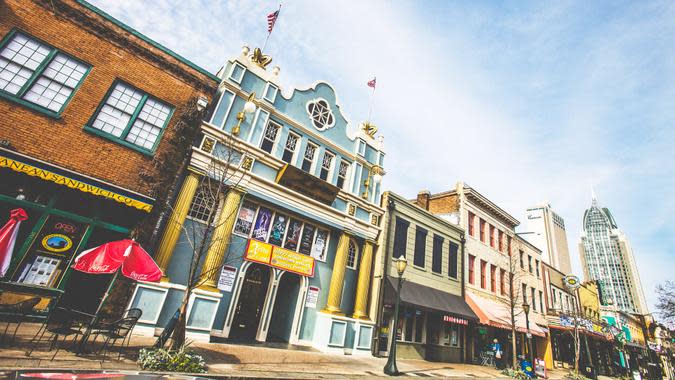

10. Mobile, Alabama
-
Typical home value: $194,348
-
Typical rent: $1,309
-
Unemployment rate: 3.5%
-
Labor force participation rate: 58.1%
-
Median household income: $48,524
-
Livability score (out of 100): 73
Try This: How I Went From Middle Class to Upper Middle Class


11. Oklahoma City
-
Typical home value: $208,400
-
Typical rent: $1,259
-
Unemployment rate: 3.5%
-
Labor force participation rate: 67.4%
-
Median household income: $64,251
-
Livability score (out of 100): 81
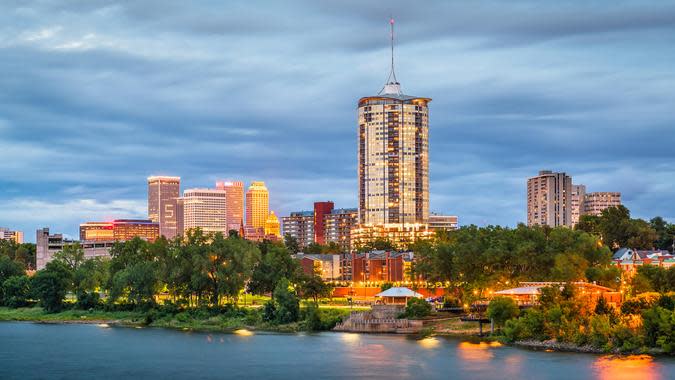

12. Tulsa, Oklahoma
-
Typical home value: $211,819
-
Typical rent: $1,256
-
Unemployment rate: 3.7%
-
Labor force participation rate: 64.7%
-
Median household income: $56,648
-
Livability score (out of 100): 75


13. Baltimore
-
Typical home value: $187,450
-
Typical rent: $1,744
-
Unemployment rate: 3.2%
-
Labor force participation rate: 62.1%
-
Median household income: $58,349
-
Livability score (out of 100): 77


14. Wichita, Kansas
-
Typical home value: $202,485
-
Typical rent: $1,094
-
Unemployment rate: 4%
-
Labor force participation rate: 66%
-
Median household income: $60,712
-
Livability score (out of 100): 68
For You: 4 Ways the Middle Class Can Make an Extra $500 a Week From Home
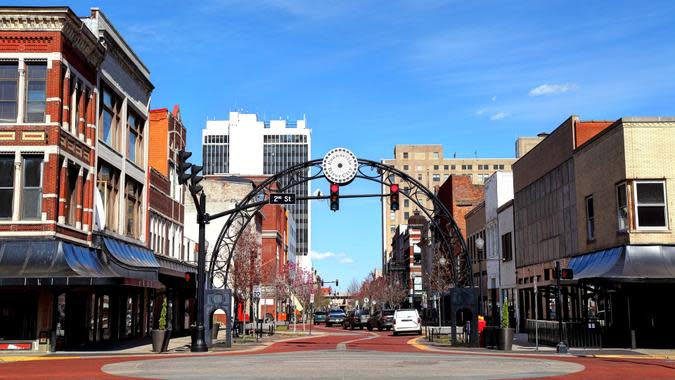

15. Evansville, Indiana
-
Typical home value: $192,114
-
Typical rent: $981
-
Unemployment rate: 4.2%
-
Labor force participation rate: 64%
-
Median household income: $49,853
-
Livability score (out of 100): 66


16. Milwaukee
-
Typical home value: $212,016
-
Typical rent: $1,322
-
Unemployment rate: 3.7%
-
Labor force participation rate: 64%
-
Median household income: $49,733
-
Livability score (out of 100): 79
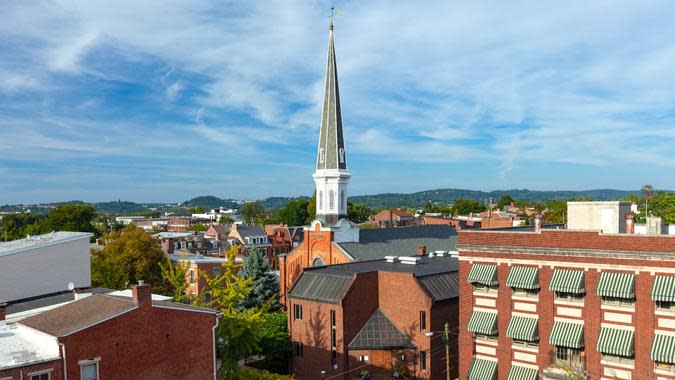

17. York, Pennsylvania
-
Typical home value: $262,440
-
Typical rent: $1,210
-
Unemployment rate: 3.6%
-
Labor force participation rate: 64.5%
-
Median household income: $42,351
-
Livability score (out of 100): 73


18. Omaha, Nebraska
-
Typical home value: $286,124
-
Typical rent: $1,390
-
Unemployment rate: 3.3%
-
Labor force participation rate: 69.9%
-
Median household income: $70,202
-
Livability score (out of 100): 83
Explore More: 6 Best Florida Suburbs to Buy Property in the Next 5 Years, According to Real Estate Agents
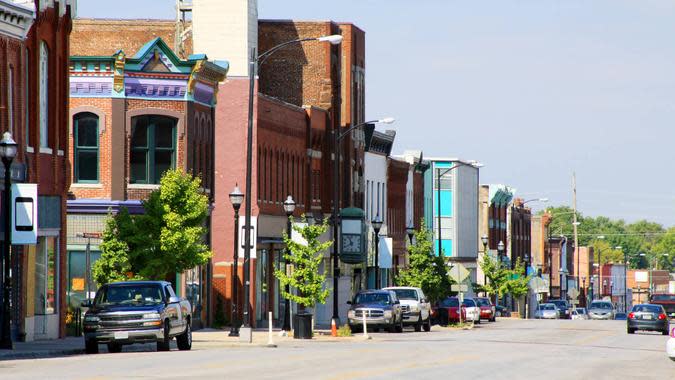

19. Springfield, Missouri
-
Typical home value: $235,075
-
Typical rent: $1,228
-
Unemployment rate: 3.8%
-
Labor force participation rate: 59.6%
-
Median household income: $43,450
-
Livability score (out of 100): 74
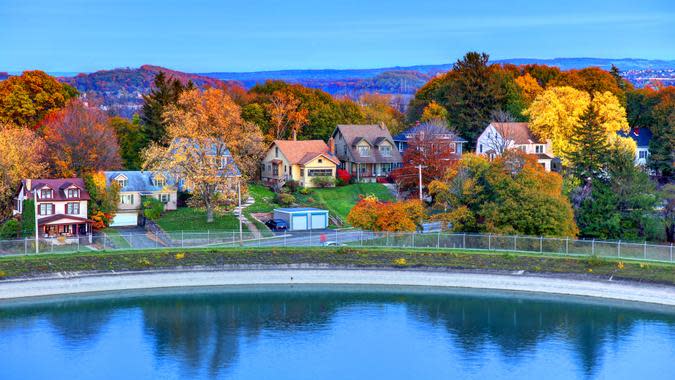

20. Syracuse, New York
-
Typical home value: $194,277
-
Typical rent: $1,499
-
Unemployment rate: 3.7%
-
Labor force participation rate: 57%
-
Median household income: $43,584
-
Livability score (out of 100): 77


21. Rochester, New York
-
Typical home value: $227,390
-
Typical rent: $1,469
-
Unemployment rate: 3.7%
-
Labor force participation rate: 61.6%
-
Median household income: $44,156
-
Livability score (out of 100): 76
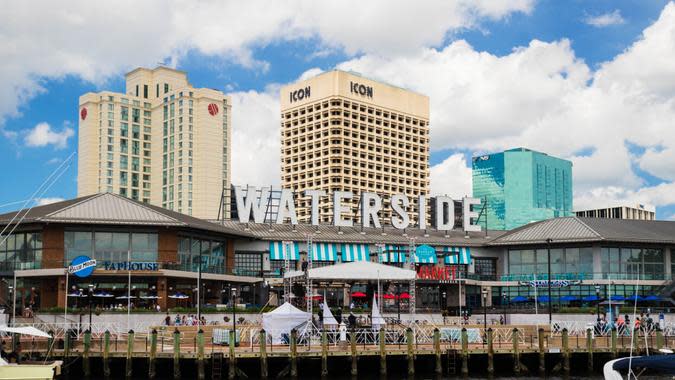

22. Norfolk, Virginia
-
Typical home value: $302,883
-
Typical rent: $1,603
-
Unemployment rate: 3.2%
-
Labor force participation rate: 70%
-
Median household income: $60,998
-
Livability score (out of 100): 81
Be Aware: 7 Worst States To Buy Property in the Next 5 Years, According to Real Estate Agents
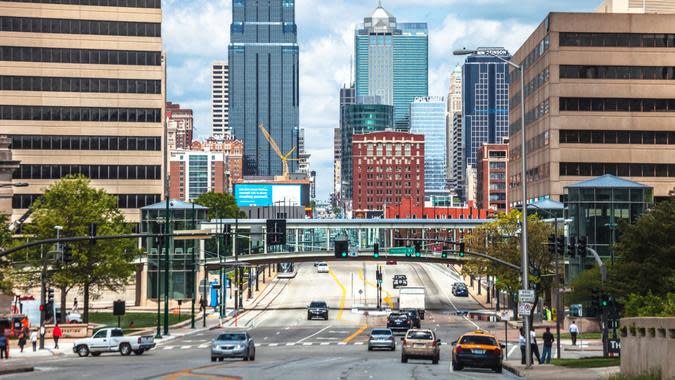

23. Kansas City, Missouri
-
Typical home value: $246,401
-
Typical rent: $1,395
-
Unemployment rate: 3.8%
-
Labor force participation rate: 69%
-
Median household income: $65,256
-
Livability score (out of 100): 78
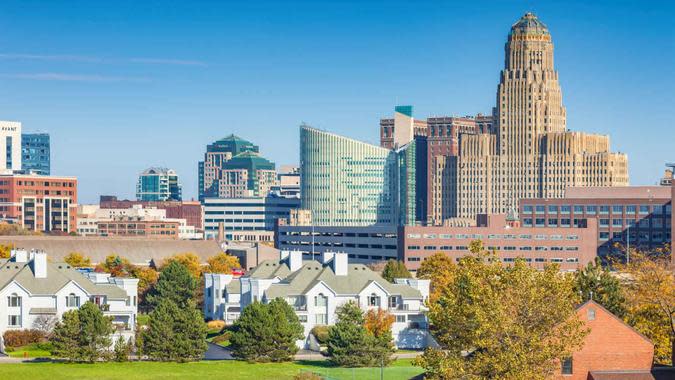

24. Buffalo, New York
-
Typical home value: $231,648
-
Typical rent: $1,389
-
Unemployment rate: 3.9%
-
Labor force participation rate: 60.2%
-
Median household income: $46,184
-
Livability score (out of 100): 79


25. Fort Wayne, Indiana
-
Typical home value: $235,574
-
Typical rent: $1,267
-
Unemployment rate: 4.1%
-
Labor force participation rate: 66.2%
-
Median household income: $58,233
-
Livability score (out of 100): 84
Laura Beck and Jordan Rosenfeld contributed to the reporting for this article.
Methodology: In order to identify cities in the U.S. that have plenty of jobs and cheap housing, GOBankingRates gathered information on the top 200 biggest housing markets in the U.S., according to Zillow. To be considered for ranking, each city had to have data available on: its June 2024 typical home value, according to Zillow, its June 2024 typical monthly rent, according to Zillow and (3) its Metro Statistical Area unemployment rate, according to the June 2024 Bureau of Labor Statistics data. The 48 cities in the final ranking have values lower than the U.S. national average in all 3 of the above factors. The highlighted cities were then scored on all three factors and ranked against each other, with factors and carrying half as much weight as factor. Supplemental information was also provided on the final 25 cities including labor force participation rate (for the population 16+), median household income from the 2022 American Community Survey and livability score from AreaVibes. All data was collected on and is up-to-date as of Aug. 5, 2024.
More From GOBankingRates
This article originally appeared on GOBankingRates.com: The 25 Best Cities To Move to With Cheap Housing and a Strong Job Market


